Power Infrastructure Demand: What Industrial Buyers Should Watch
Electricity-demand forecasts can explain market context, but they cannot confirm a site connection or an equipment delivery date. A dated reading of public evidence helps buyers separate broad signals from project commitments.
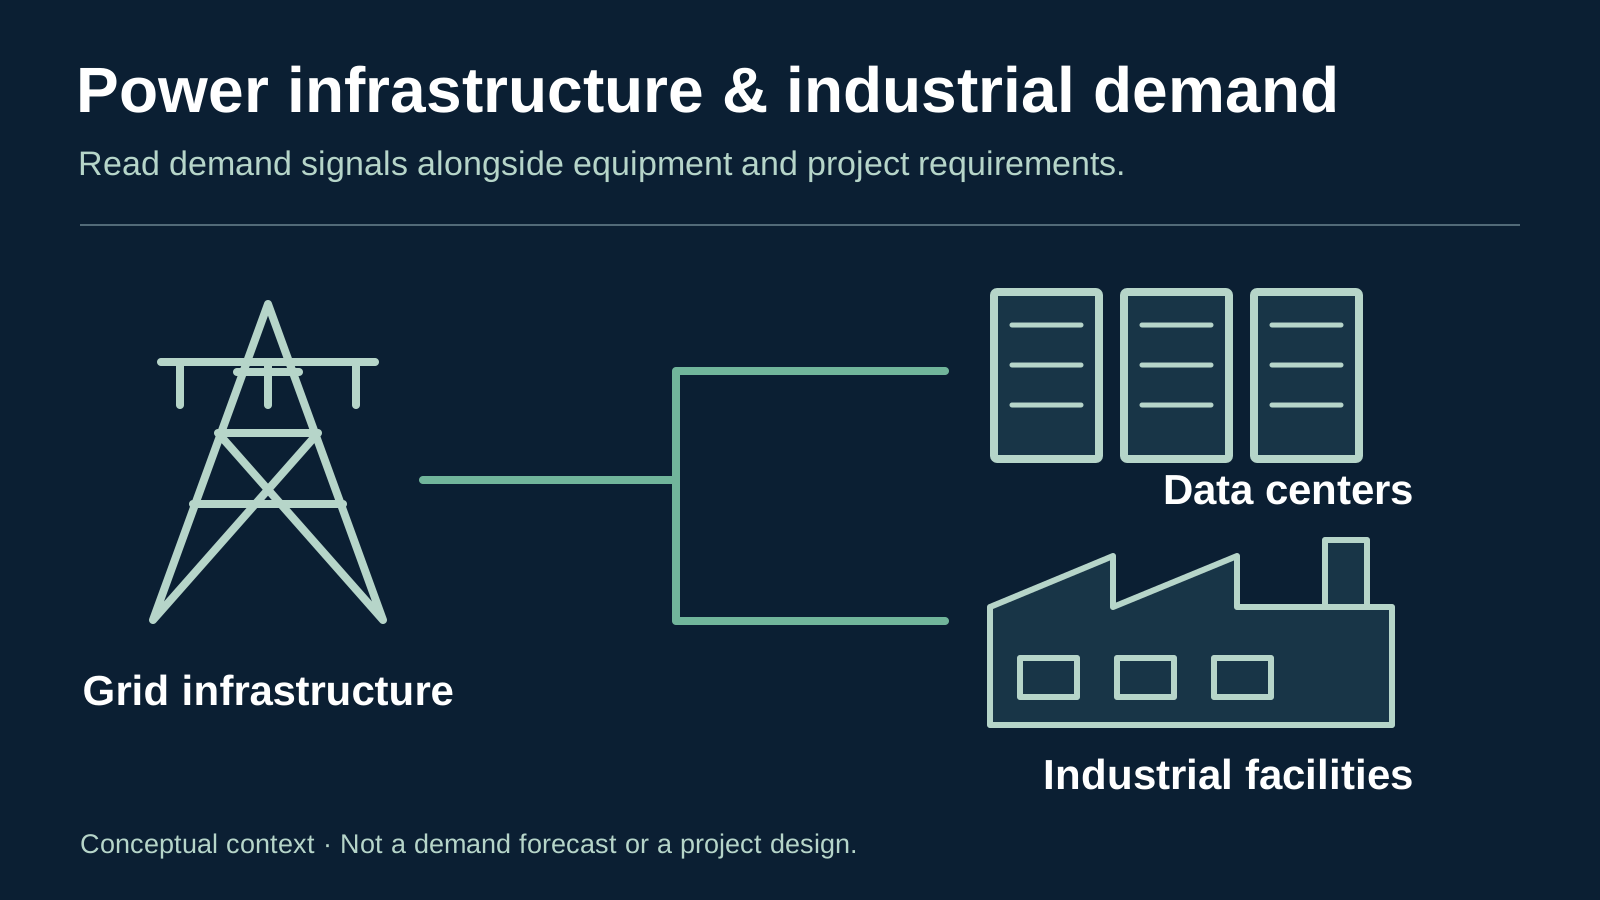
Conceptual relationship between grid infrastructure and electricity-consuming facilities. No forecast values, site design or Aurona project is depicted.
Original Aurona editorial illustration
Key takeaways
- Label every demand figure with its source date, geography, period and measure.
- Keep historical estimates, forecasts and modeled scenarios distinct.
- Use market context to inform questions; rely on project and supplier evidence for commitments.
Read this brief as a dated market context
Research for this brief was checked on October 8, 2026. The near-term national outlook below is the EIA release dated October 6, 2026, while the longer-range data-center study and regional example are explicitly identified by their earlier dates. They answer different questions. They should not be combined into a single forecast of equipment orders, prices or delivery schedules.
For an industrial buyer, the useful question is how these signals affect the information needed for a project decision. A national demand trend may justify closer planning attention. It does not establish the capacity available at a particular connection point, the progress of a utility review or the production slot offered by a particular manufacturer. Keep each of those decisions tied to its own evidence and responsible party.
Separate the near-term forecast from observed conditions
The October EIA outlook reports U.S. electricity consumption in the third quarter of 2026 about 4% above the same quarter of 2025, with summer heat contributing to cooling demand. For 2027 it forecasts commercial-sector consumption growth of 2.8% and industrial-sector growth of 2.7%, while residential consumption is expected to be largely unchanged. Those are sector-wide figures; commercial consumption is not a measure of data centers alone.
These figures distinguish a reported period from a future estimate. They also show why a single growth percentage needs a label: geography, period, sector and measure all matter. A buyer discussing a facility expansion should avoid converting a national annual-energy growth rate into an assumed local peak demand. The facility load profile and the utility’s project-specific review remain separate inputs.
References: [1]
Treat data-center scenarios as scenarios
Berkeley Lab’s December 2024 report estimated that U.S. data centers used 176 TWh in 2023, or about 4.4% of U.S. electricity consumption. Its modeled 2028 range was 325–580 TWh. That range came from a study prepared in 2024; it is not a measurement of 2026 use or a promise that a particular 2028 outcome will occur.
The planning value lies in understanding uncertainty rather than selecting the largest number for a headline. Growth depends on assumptions about equipment, deployment and operation. For an equipment inquiry, describe the owner’s actual project stage and expected phasing. If later phases remain conditional, identify them separately from the present purchase. That gives suppliers a clearer basis for distinguishing a firm equipment requirement from a possible future expansion.
References: [2]
Watch project maturity in regional forecasts
PJM’s January 14, 2026 explanation of its annual long-term forecast reported lower near-term projections through 2032 than the prior year’s forecast, while still describing significant long-term growth. It cited changes in assumptions and improved vetting of large-load requests. This is a dated example of forecast revision, not a claim that the January forecast is the newest PJM update or that realized demand fell.
For procurement, the example makes an important distinction: a proposed project and a sufficiently developed project do not carry the same evidentiary weight. Ask what the site team has confirmed about utility engagement, design maturity and phased energization. Track those milestones independently from equipment selection. A favorable national demand narrative cannot substitute for a written project decision from the relevant utility or owner.
References: [3]
Keep supply constraints and model assumptions visible
DOE’s distribution-transformer work identifies manufacturing and component constraints as an area requiring attention and includes work on interchangeability and reducing unnecessary design variation. That provides context for asking careful specification questions. It does not establish one current lead time for every transformer, authorize substitutions or show that any particular unit is available.
A separate EIA sensitivity analysis published March 12, 2026 modeled higher demand while retaining the generating-capacity assumptions of its February outlook. It illustrates how a modeled outcome depends on what is held constant. It should not be read as the October baseline. The same discipline helps procurement: state which assumptions support a quoted schedule, what has been confirmed, and which changes would require a new response.
Build a watchlist around decisions you can verify
A useful project watchlist connects external context to specific decisions. Track the owner’s approved equipment scope, the controlling drawing revision, open utility questions and the date a supplier last confirmed the proposal. Keep a place for the next action and the person responsible. Updating a market chart is less useful if an unresolved interface still prevents the equipment package from being reviewed.
For example, a planned capacity expansion might include an immediate transformer purchase and a later switchgear extension. Treat the two scopes separately unless the responsible team has committed to a combined release. Record whether provisions for the later phase are part of the present requirement. Ask suppliers to identify assumptions and quote validity. This is a hypothetical planning example, not evidence of an Aurona customer project or a particular supplier’s capacity.
Recheck the evidence before a commercial decision
Check for a newer EIA release before reusing the national figures. Check the relevant regional operator and utility for the latest applicable information rather than treating a national forecast as a site assessment. Retain the edition and date of any forecast used in a project memo so later revisions can be distinguished from the assumptions that informed the original decision.
The strongest purchasing record separates three things: external market context, the buyer’s approved requirement and the supplier’s actual proposal. Each can change on a different timetable. A demand forecast may help explain why a team is planning early, but only project-specific review and supplier confirmation can establish what is being offered, under which conditions and on what schedule. Public forecasts do not demonstrate Aurona inventory, allocation, manufacturer relationships or guaranteed availability.
Sources & further reading
- Short-Term Energy Outlook — October 2026
U.S. Energy Information Administration · · Accessed
- 2024 United States Data Center Energy Usage Report
Lawrence Berkeley National Laboratory · · Accessed
- PJM’s Updated 20-Year Forecast Continues To See Significant Long-Term Load Growth
PJM Interconnection · · Accessed
- Distribution Transformers
U.S. Department of Energy, Office of Electricity · Accessed
- Fossil generation could rise with faster-than-expected growth in data center power demand
U.S. Energy Information Administration · · Accessed